
13 Sep HPCC Report For Week 2
After receiving the tasking of analyzing the Telematics data, I separate this project to the following steps:
- ETL process. Upload data to our server, transfer the data to RECORD structure and clean this data.
- Convert the clean data to the car-trip structure. Define the table structure with unique columns of the device ID and trip ID. Calculate the start time, end time, average speed, average RPM and so on for further analyze
- Present the result by ECL graph to describe the tendency. Such as, compare the average during the time of each trip for all the vehicle by ECL graph module.
From Aug 12 to Aug 16, I split the data to a small dataset which contains cars the id is 0, 5 and the trip id is 1, 2. This method will save more time and accuracy. After the previous steps have finished, it’s not hard to upload the whole data and running the same program to get the final result. This raw dataset contains 1,048,575 lines of data.
Following is the result of my processing for the data order by step:
- Upload data to our server
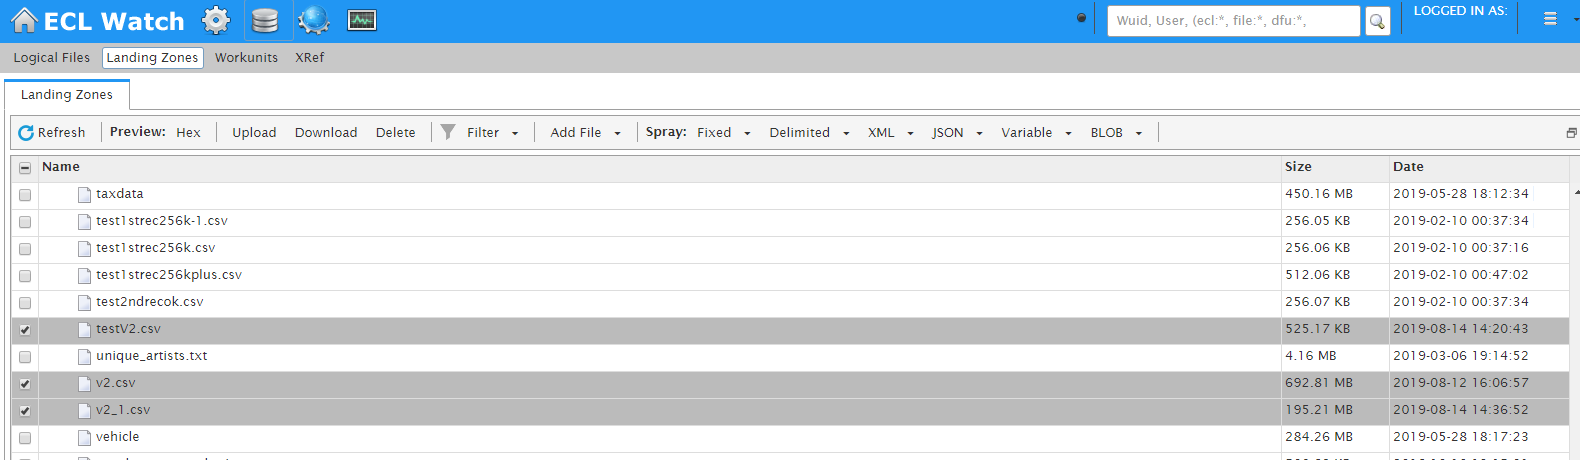
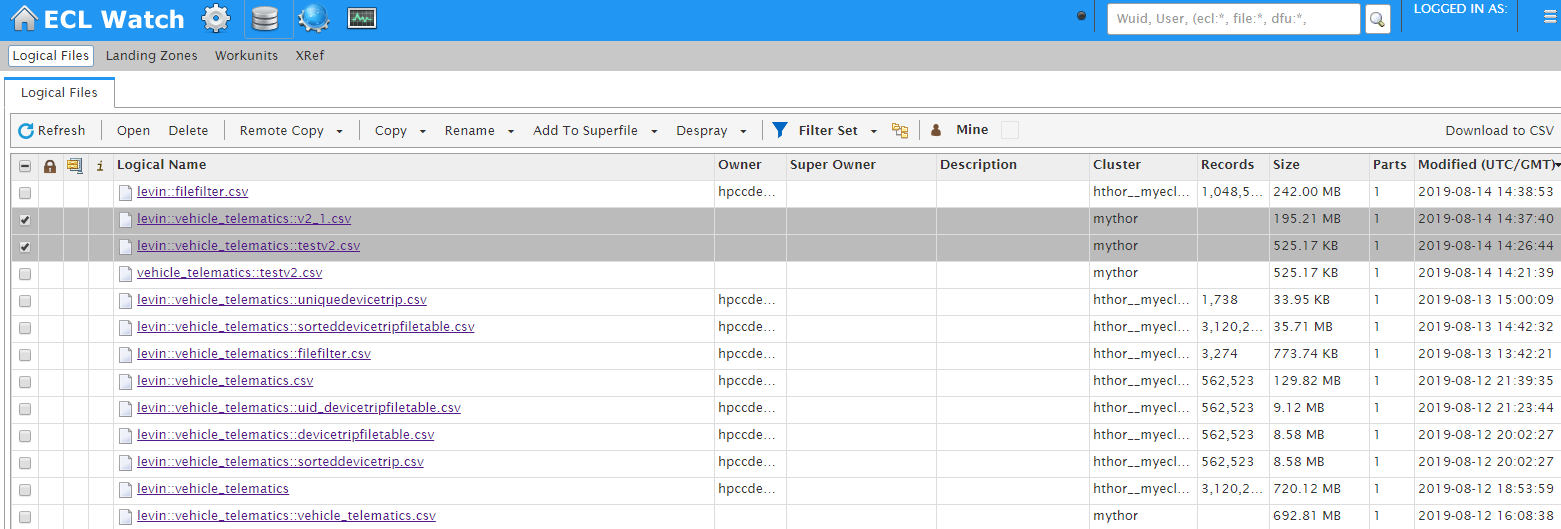
- Transfer the source file to logical file
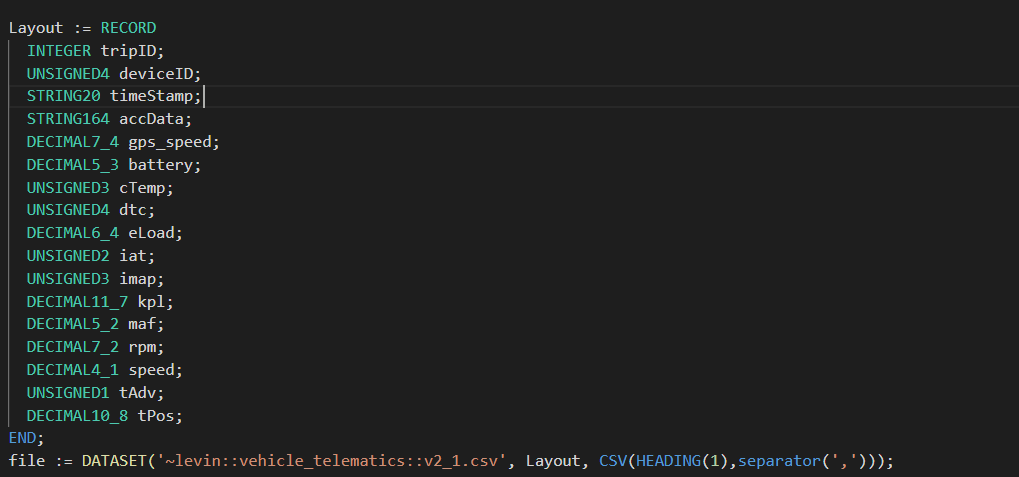
- Implement the logical file with RECORD structure
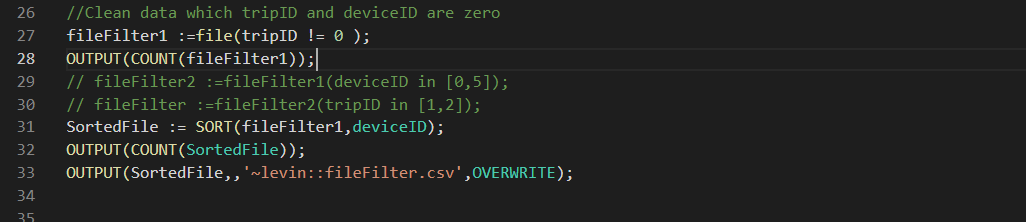
- Clean the data, sort the data and store it.
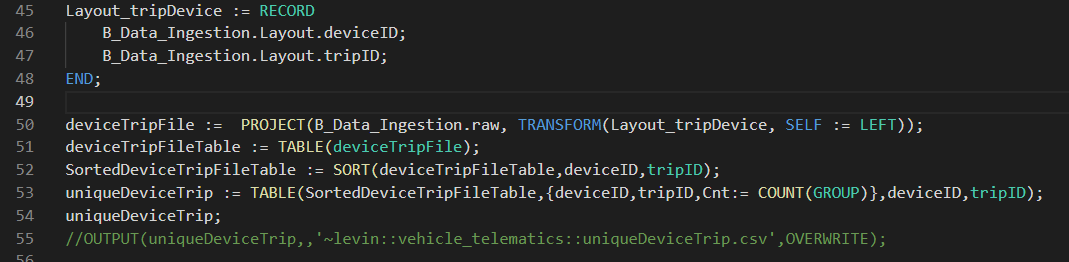
- Read the clean dataset, convert it to car-trip structure and sort this table.
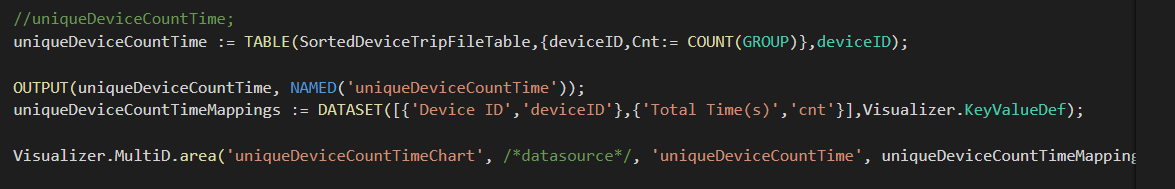
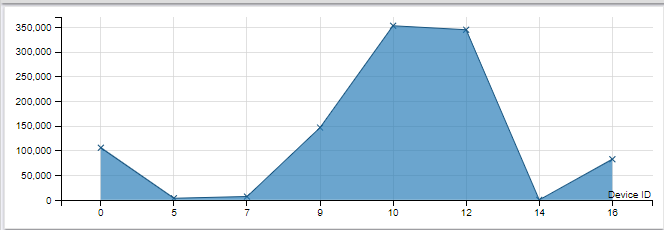
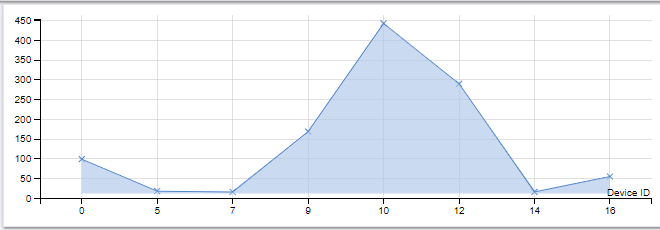
- Count the total time for each car and display the result by the graph.
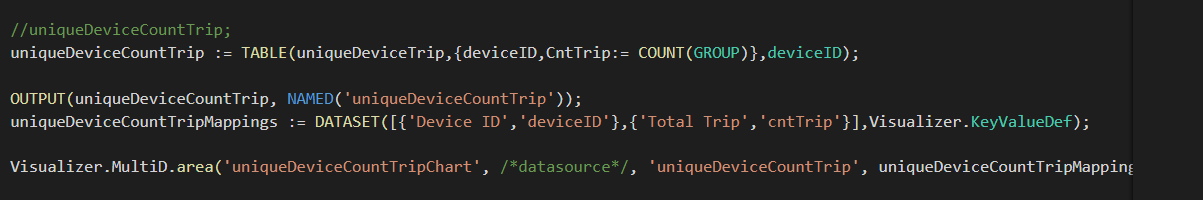
- Count the trip for each car and display the result by a graph.
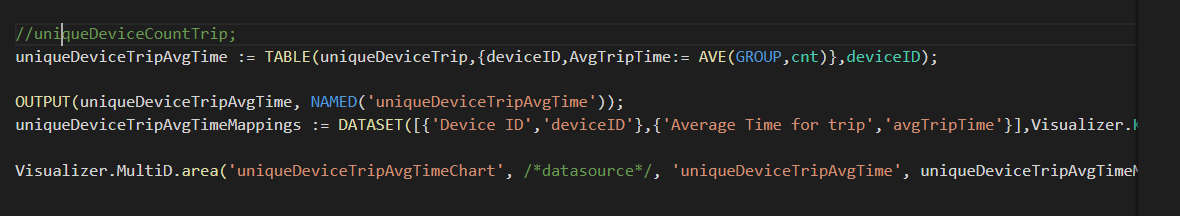
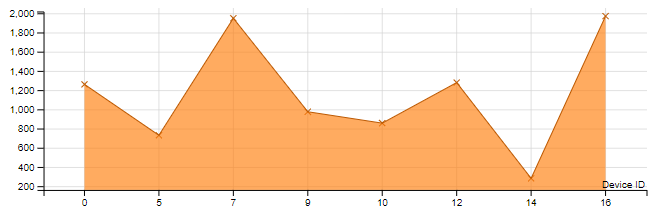
- Count the average time for each trip by car and display the result by the graph.
No Comments